Time Management Statistics for 2025 and What They Teach Us

How many times have you wished for your day to last longer?
Well, if it weren’t for certain temptations, it probably would last longer. Statistics show that we spend almost 3 hours browsing social networks daily.
Social media is just one of many culprits for our lack of time. So, we need to figure out where our time goes.
We’ve compiled the ultimate list of time management statistics to show why it matters, how it affects work-life balance, and how you can improve the situation for yourself and others.
KEY TAKEAWAYS
- 82% of people don’t use a time management system.
- Knowledge workers spend 88% of their workweek communicating — managing emails, attending meetings, and using team chat apps.
- 41%% of employees consider chatty coworkers as their top work distraction.
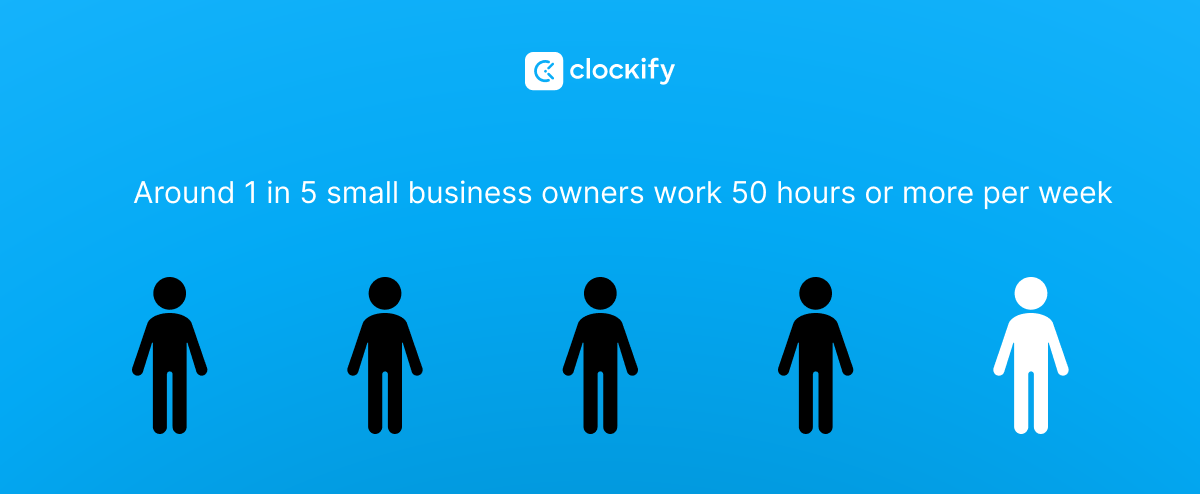
- 19% of business owners work 50 hours a week.
- 87.7% of company owners struggle with mental health issues.
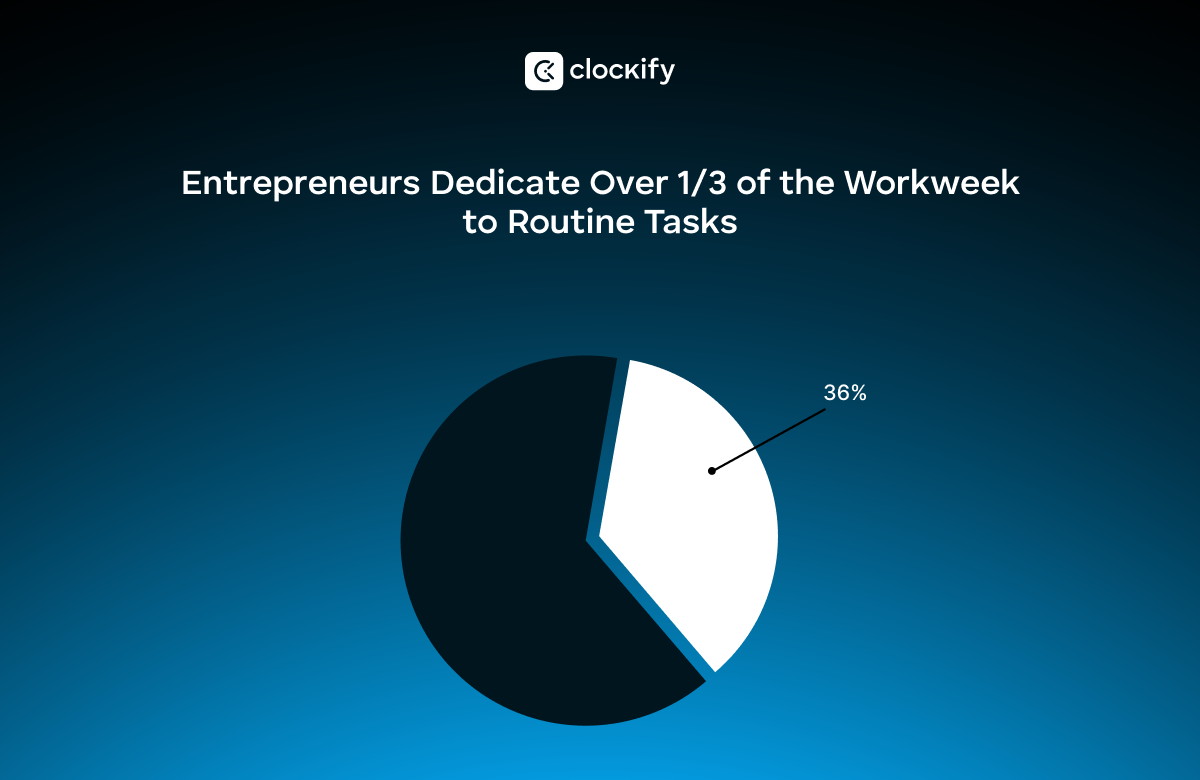
- Entrepreneurs devote 36% of their week to administrative tasks.
- The average person spends 6 and a half hours online every day.
- 12% of our time goes to housework daily.
- Women do 58% of the domestic work every day.
- 75.5% of students struggle with procrastination.
General time management statistics
You can never find time for anything, but you can make time for something. Let’s see how many people have it under control in all aspects of life.
82% of people don’t have a time management system
According to Acuity Training’s research on time management, only 18% of people have a dedicated time management system.
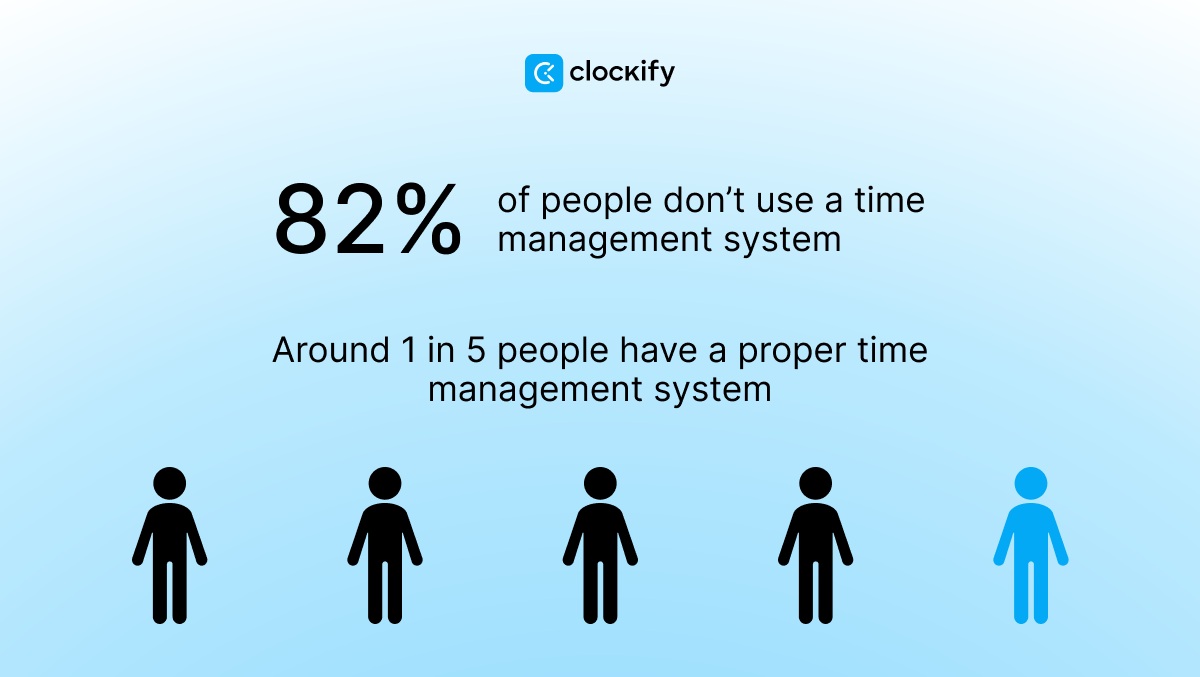
In contrast, a staggering 82% of people don’t have a time management system.
Instead, the survey reveals that they use alternative methods, including:
- 33% of people use to-do lists,
- 24% of people use email inboxes, and
- 12% of people schedule tasks in their journals.
These personal time management statistics imply that many people don’t organize their time around daily tasks. Without a plan, your days can become unpredictable and unmanageable — hindering your productivity and well-being.
🎓 7 Common Time Management Problems (And How to Fix)
21% of people feel like they never have work under control
We’re living in times of stress, where prioritizing your health is the top survival tactic. But, according to modern research, that’s easier said than done.
For instance, the above-mentioned Acuity Training survey showed that 66% of people feel in control of their work at least 3 days a week.
Unfortunately, 21% of people struggle to stay on top of their job, saying they never or rarely manage tasks successfully. In fact, the most likely culprits that take away your time at work are:
- Distractions,
- Poor planning habits,
- Procrastination,
- Multitasking, etc.
Manage your time efficiently with Clockify
Taking ownership of your time will determine your productivity in the workplace. So, try to understand how you spend time, create a work schedule, and eliminate harmful habits and distractions.
🎓 Track Daily Activities and Habits for a More Productive Day
50% of people use the Eisenhower Matrix to keep work under control
Keeping your life under control will depend on how you turn the wheels of time. Studies have shown that people can improve their time management by using a successful strategy.
In fact, the Acuity Training survey concluded that 50% of participants who use the Eisenhower Matrix feel in control of their tasks every day. In other words, they successfully manage assignments by ranking them based on urgency and importance.
As the second best method, the Pomodoro technique helps 60% of participants handle their tasks 4 or 5 days a week. So, working in 25-minute intervals separated by 5-minute breaks helps this group stay productive.
Naturally, having no strategy is the least successful approach to organizing day-to-day activities.
The data above confirms that productive habits like sticking to a time management strategy can yield positive results — including increased productivity and low stress.
🎓 The 26 most effective time management techniques
Statistics on time management in the workplace
The saying "Time is money" applies to any business scenario. Therefore, the key aspects of success include productivity, task prioritization, and time management.
Let's step into the shoes of both employers and employees and see how they manage time at work to stay productive.
Time management statistics for employees
How employees spend their work hours isn’t always up to them. From attending countless meetings to addressing burning issues — employees worldwide have to put in constant effort to manage their time effectively.
Let’s see what the numbers say.
Knowledge workers spend 88% of their workweek communicating
Grammarly’s 2024 State of Business Communication discovered that knowledge workers invest 88% of their workweek into communication. This includes time spent managing emails, attending meetings, and communicating via team chat apps.
If we look at the statistics on weekly communication across various channels, that’s:
- 10.45 hours spent in meetings,
- 5.94 hours spent on emails, and
- 3.89 hours spent on text-based chat.
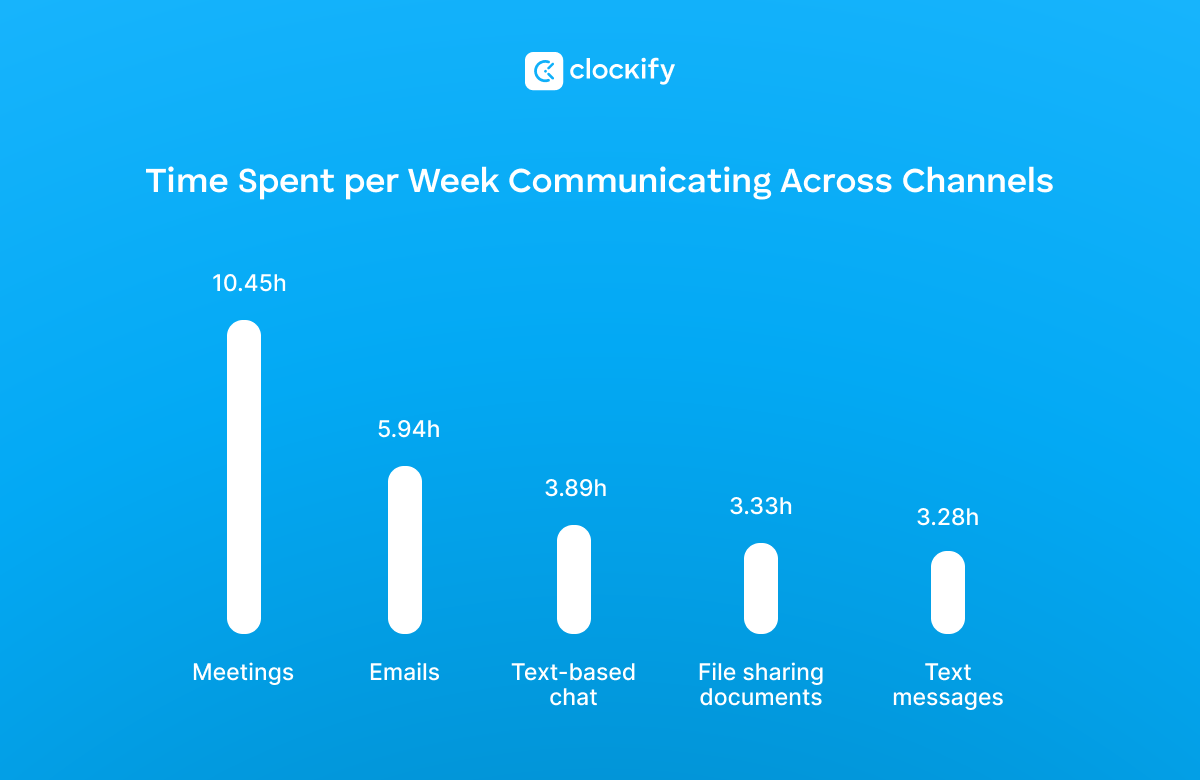
Interestingly, Grammarly’s data revealed that knowledge workers lose 19 hours a week to written communication.
The report attributes written correspondence to the rising anxiety among employees. Over half of the surveyed professionals feel stressed by miscommunication in writing.
🎓 How to manage email productivity: Tips from Patty Kreamer, a professional organizer
71.1% of American workers feel expected to answer emails after hours
Bringing work home or working overtime can affect your mental health, leading to job burnout. Additionally, working beyond the clock can trigger complications in other aspects of life, like:
- Interpersonal relationships,
- Social life,
- Time for hobbies, and
- Self-improvement time.
Arguably, the goal of mastering time management is to achieve the ideal work-life balance.
Yet, a 2024 Email & Work Communications Burnout study showed that 71.1% of American employees believe they are expected to answer emails after hours.
Similarly, Robert Walters’ poll on workforce struggles found that 76% of UK workers check emails during nonbusiness hours. Additionally, a fifth of them report that their employer contacts them outside of work.
In short, modern employees are drawn to refreshing their inboxes even after work — a harmful habit that only increases stress.
Chatty coworkers are the most common distraction at work
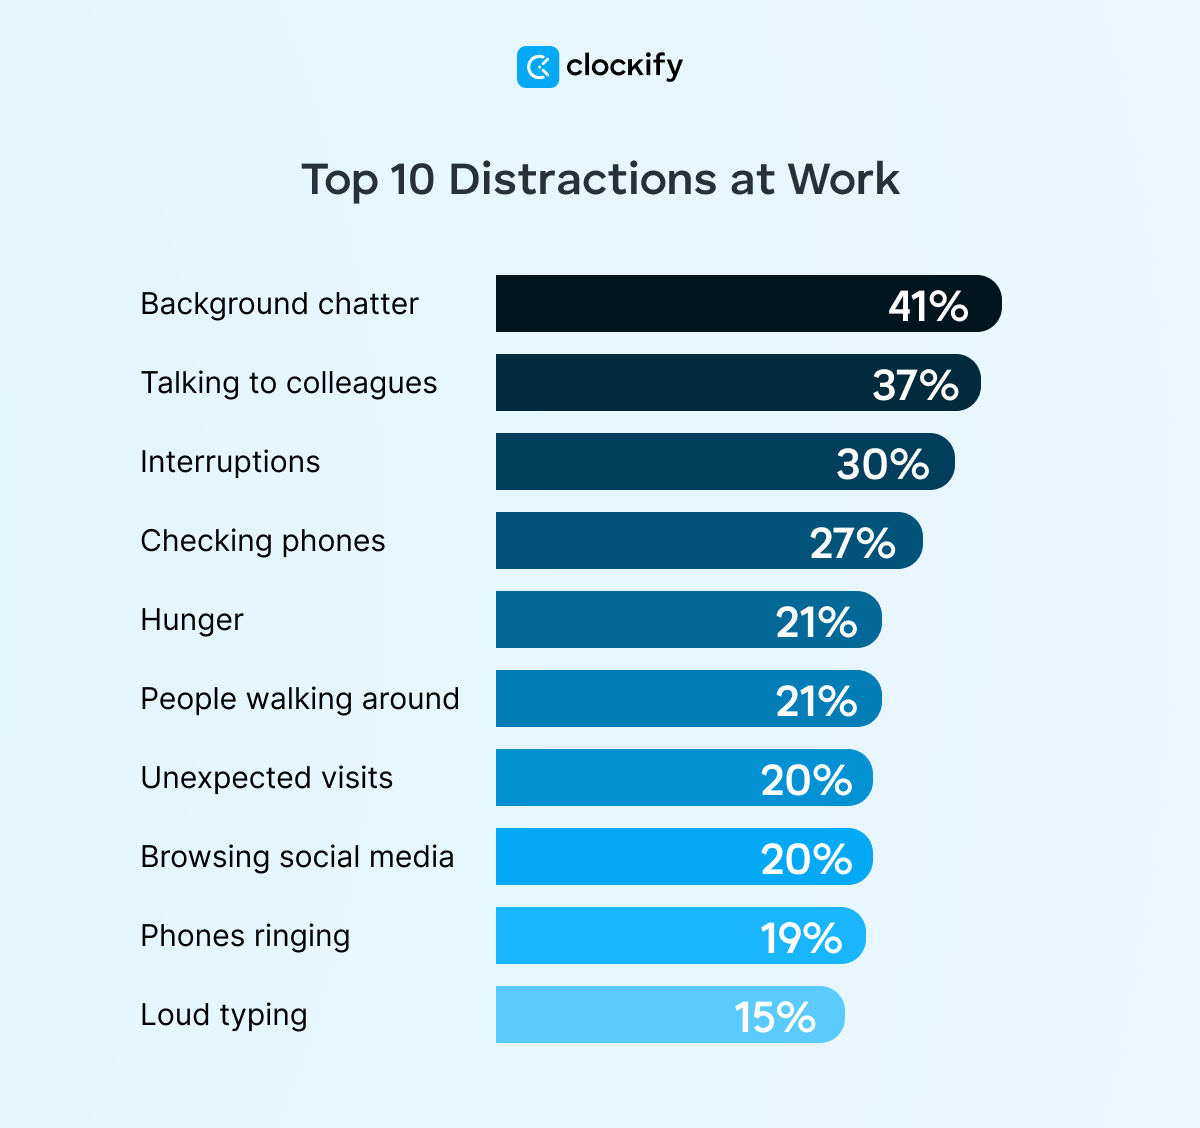
Based on a 2024 report on work interruptions, UK employees lose up to 15 hours weekly to different distractions. The research also showed that 67% of all participants deal with distractions every working day.
Reportedly, chatty colleagues are the biggestdistraction among UK professionals — 41% of them blamed their lack of focus on coworkers talking in the background. Interestingly, 37% of employees reported distracting themselves by talking to others.
Besides side discussions, the most common focus disruptors include:
- Interruptions,
- Desire to check phones,
- Hunger, and
- Desire to browse social networks.
🎓 Effects of workplace distractions: Crucial statistics
In the US, the average time spent at work per year is 1,976 hours
Due to various cultural, geopolitical, and economic factors, different regions have different standards for what counts as a regular workload per week.
For this reason, the average number of hours people work varies by country. Yet, the lowest average time at work is in Vanuatu — 1,284 hours per year.
Other countries with workweeks on the lower end are:
- The Netherlands — 1,643 hours per year,
- Somalia — 1,633 hours yearly,
- Micronesia — 1,581 hours per year,
- Rwanda — 1,581 hours yearly, and
- Kiribati — 1,420 hours per year.
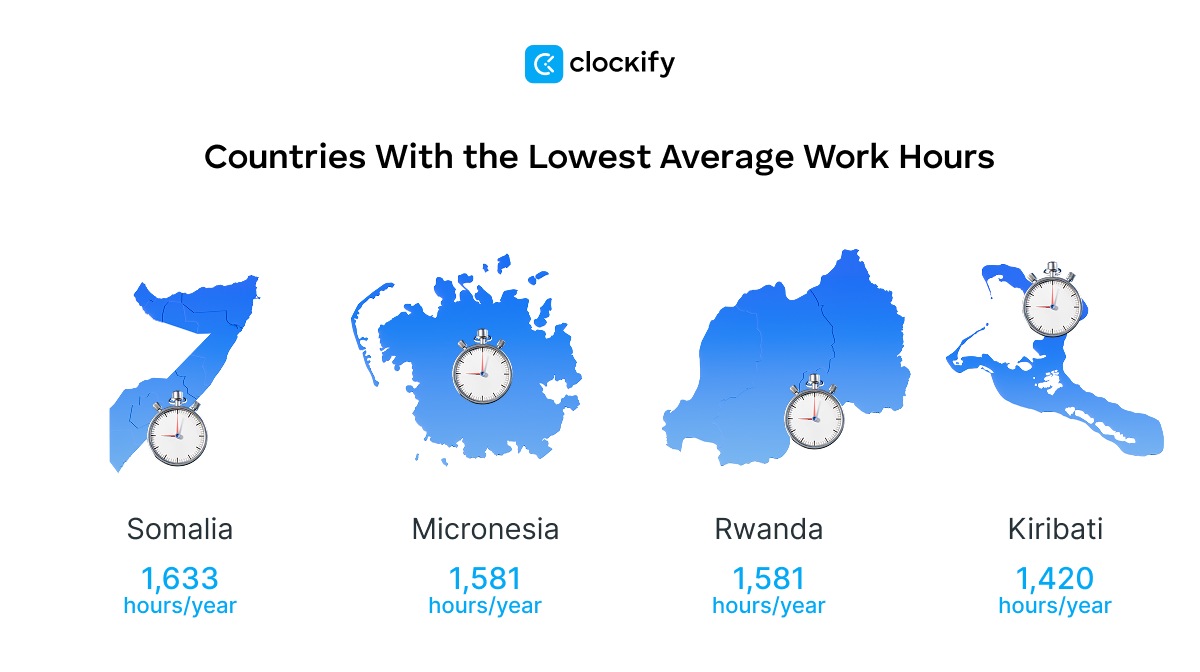
On the other hand, Bhutan has the highest average,with a worrying 2,829 hours per year. The US is somewhere in between, with an average of 1,976 hours.
Clearly, how people manage their time also depends on the region, as cultural values and the perception of time differ.
So, 2 people with equally strong time management skills will be perceived differently in different parts of the world.
🎓 How Many Work Hours Do You Work in a Year?
60% of job hunters prioritize hybrid work arrangements
A fixed schedule may be beneficial, but not for everyone. For example, many parents with young children find the 9-to-5 schedule problematic and prefer starting earlier.
Similarly, new studies suggest that more work flexibility has become a top motivator for employees.
To illustrate, the latest Robert Half report on remote work trends surveyed US job seekers and found that:
- 60% of them look for hybrid roles, and
- 37% of them look for fully remote positions.
Flexible working hours offer multiple benefits, leading modern employees to expect a degree of flexibility.
This is no surprise, particularly when we consider the abundance of time management apps that assist employers and employees in staying organized.
🎓 10 Fast Ways to Improve Employee Productivity in the Workplace
Only 31% of employees feel engaged at work
As a recent Gallup survey on employee engagement shows, dedication to work among the US workforce is at an ultimate low.
The 2024 research found that only 31% of employees felt engaged while 17% felt actively disengaged from work. Prolonged dissatisfaction often leads to quiet quitting — doing the bare minimum at work.
Of the engagement elements measured, the ones with the largest decline include:
- Clarity of expectations — 46% of workers know what’s expected of them,
- Employee support — 39% feel that someone cared about their well-being, and
- Workplace encouragement — 30% say that someone encourages them at work.
Track your productivity with Clockify
Another Gallup report on US employee detachment revealed that low engagement and the subsequent productivity loss cost the US economy up to $1.9 trillion.
Although workplace culture matters, employees need to be more proactive and start measuring their productivity.
🎓 How to Be Proactive and Take Control of Your Work And Life
Time management statistics for business owners
From making the most of their office hours to leveraging automation, leaders worldwide share one simple goal — making their efforts count.
Let’s break down time management for business owners into numbers to see how they use time to achieve success.
19% of business leaders work over 50 hours a week
The Nerdwallet report on small business challenges in the US revealed that the average company owner works 30 hours per week.
Interestingly, the research also showed that 35% of entrepreneurs work fewer than 20 hours per week, while 19% work 50 hours or more weekly.
However, the recent Founder report on entrepreneurial mental health found that 87.7% of small business owners struggle with mental health issues.
In particular, 34.4% of entrepreneurs feel burnt out, which makes up ⅓ of all surveyed entrepreneurs. In fact, they claim that long hours and constant focus on work are to blame.
Evidently, CEOs experience burnout differently due to their varying work dynamics. Their personal and professional lives tend to intercept, leading to an even more intense burnout experience.
In fact, the above Founder poll highlights the often seamless intrusion of work into personal life, revealing that 26.9% of entrepreneurs have a poor work-life balance.
Although the numbers don’t specifically point to a lack of proper time management, they show the challenges that leaders face, including their workload.
By handing over tasks that don't require direct supervision, leaders free up their schedule and foster a culture of ownership — where each person contributing to the company feels engaged and performs better.
Leaders who don’t take breaks from work hurt their leadership skills
Apart from burnout, leaders who don't unplug from work risk draining their mental resources. In fact, contemplating work during nonbusiness hours can hurt their capacity to lead.
One solution for preventing work from creeping into the off-hours is to complete as many tasks as possible while at work. That way, the boundary between leadership responsibilities and personal life remains intact.
Different time management methods can also do the trick, like:
- The timeboxing method (dividing your day into time blocks), and
- The Eisenhower Matrix (prioritizing tasks based on importance and urgency).
Overall, business leaders can reduce cognitive overload by adjusting workloads, addressing burnout signs, and prioritizing their tasks.
Track your tasks with Clockify
26% of employees use messaging apps for team collaboration
A 2025 report on workplace communication showed that 26% of employees use team messaging apps for internal communication, while 10% use them to communicate with clients.
The report also reveals that effective communication may increase team productivity by up to 25%.
In fact, the latest research on employee retention strategies suggests that using clear communication and transparent leadership significantly impacts employee retention.
So, knowing where team collaboration happens most efficiently helps organizations improve time management and employee satisfaction.
🎓 10 best team chat apps for remote businesses
Entrepreneurs spend 36% of their week on administrative tasks
Although payroll processes, performance reviews, and emails are necessary operational tasks, that doesn’t mean they don’t slow down other high-value tasks.
As Time etc’s survey of US-based entrepreneurs shows, company owners spend 36% of their work weeks on routine tasks, like invoicing or ordering office supplies. Their reluctance to delegate tasks can lead to slow company growth and poor mental health.
Time-wise, part of the solution could be to automate repetitive processes. According to the 2024 Future of Work report, 37% of surveyed employees believe advanced technologies will automate 30% of their work.
Payroll and invoice processing also rank high on the scale of repetitive, time-eating processes.
So, entrusting payroll apps with these tasks would enhance work productivity.
🎓 How Clockify gives Flobotics a competitive edge in the RPA industry
Statistics on time management and free time
According to the OECD Time Use Database, the average person gets around 300 minutes of leisure time daily. Yet, we don’t always spend all of it intentionally, which can affect our happiness.
Let’s explore the time management stats and see exactly how we leverage our free time.
Statistics about time management and the Internet
The World Wide Web can be an amazing resource for improvement and learning. However, we can easily get sucked into streaming or scrolling through social media for hours.
Without a proper time management system, the fast-growing number of daily distractions can mess up our productivity rhythm.
A paper on digital era downsides blames technology for our shortened attention spans and loss of focus, which impacts creative and critical thinking.
In particular, our smart devices and high-speed internet connection enable 24-hour online presence — making us more easily distracted.
The average person spends over 6 and a half hours online
As the Digital 2025 Global Overview Report shows, we spend an average of 6 hours and 38 minutes online per day.
The research also revealed that 68% of people worldwide use the Internet, which translates to a whopping 5.5 billion web users. These numbers testify to the rapid spread of Internet use.
The current data on why people use the Internet says a lot about their intent, common behavior, and habits. Globally speaking, the top 15 reasons people go online include:
- Finding information (62.8%),
- Contacting family and friends (60.2%),
- Reading news (55%),
- Watching videos, TV shows, and movies (54.7%),
- Doing “how to” research (51.1%),
- Getting inspired or finding new ideas (47%),
- Listening to music (46.7%),
- General browsing (45.2%),
- Searching for brands and products (45.2%),
- Researching places and travel (38.9%),
- Studying and education (38.7%),
- Finance management (35.9%),
- Researching health issues and products (35.4%),
- Gaming (30.4%), and
- Business-related research (30.1%).
Modern man surfs the web for general information, connection, and entertainment — while education, business, and finance-related research fill the low end of the list.
In other words, not many of these reasons can be considered productive.
🎓 Personal productivity guide: Maximize productivity with these methods and apps
Americans spend 5 hours online on their smartphones
Smartphones are a source of constant distraction. Every year, larger screens and better internet connections only aggravate this issue.
The Digital 2025 Global Overview Report also revealed that a stunning 5.78 billion people use a mobile device, which accounts for 58% of the world’s population.
Based on the report above, 96.3% of people connect to the internet using mobile phones (mobile devices with few options, mainly used for calls and texts). Additionally, 94.2% of people access the web via smartphones.
Smartphones and tablets come in handy when we're on the go. However, most of us don't use them only for relevant matters — nor only on the go.
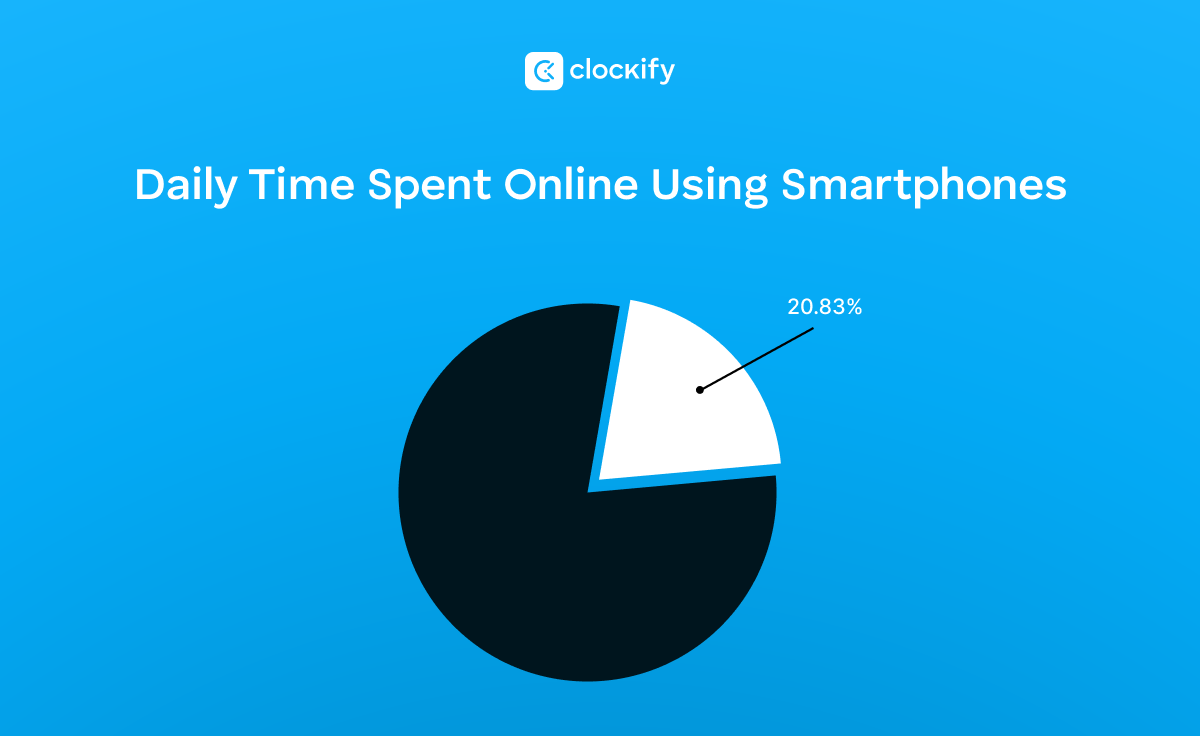
In fact, the Reviews.org survey on internet screen time found that Americans spend 5 hours a day online on their smartphones.
Today, internet use has expanded to include essentials (like checking emails) and entertainment (like streaming favorite TV shows). But this luxury often comes at the cost of neglecting our priorities.
People spend 2 and a half hours using social media
The Digital 2025 Global Overview Report showed that the average internet user spends 2 hours and 21 minutes per day on social networks.
As per the report, there are 5.24 billion active social media accounts. That means we collectively spend almost 740 billion minutes per day on mediaplatforms.
The research also shares index scores showing the total user time spent on social media apps:
- YouTube (100),
- TikTok (55.4),
- WhatsApp (52.4),
- Facebook (52.3),
- Instagram (42.5),
- Messenger (5.9),
- Telegram (5.5),
- X (3.7),
- Snapchat (2.8),
- Kwai (1.3),
- Discord (1.3),
- Line (1.2),
- Pinterest (1.0),
- VK (0.9), and
- Reddit (0.7).
Naturally, these platforms aren’t mutually exclusive — you can usually reach the same user on multiple apps.
To sum up, our social media activity is rooted in our daily routine. But as our Internet dependence grows, our productivity dwindles.
Statistics about time management and sleep
Many aspects of time management are directly related to cultural differences, including the perception of time.
Regardless, all cultures have one thing in common — the connection between getting enough sleep and happiness. Numerous studies on sleep health recommend between 7 and 9 hours of sleep for adults.
But do we always get the required minimum hours of sleep?
Let’s see what personal time management statistics say about this.
Japan gets only 6 hours of sleep per night
Getting a good night's sleep has multiple benefits that go beyond better time management.
According to the 2024 Global Sleep Survey, getting enough sleep leads to a 60% improvement in work productivity. What’s more, being well-rested improves your focus and happiness.
Likewise, the 2025 IKEA Sleep Report shows that Japan sleeps only 6 hours and 10 minutes per night — earning the title of the most sleep-deprived country. On the other hand, 82% of people in Mainland China rarely feel tired after waking up, making them the best-rested nation.
Interestingly, the report also found that Americans have the most disrupted sleep, rating their sleep quality at just 57 out of 100.
With a global average sleep score of only 63 out of 100, we must rethink our sleep habits to become more productive.
46% of Americans with poor sleep quality have mental health issues
As you age, the amount of sleep you need varies. But that doesn’t diminish the importance of sleep for your emotional health.
As the 2024 survey by Sleep Foundation.org shows, 46% of Americans with below-average sleep quality also report poor mental health.
Additionally, people with mental health problems sleep 6.3 hours a night — nearly 1 hour less than those with above-average mental health.
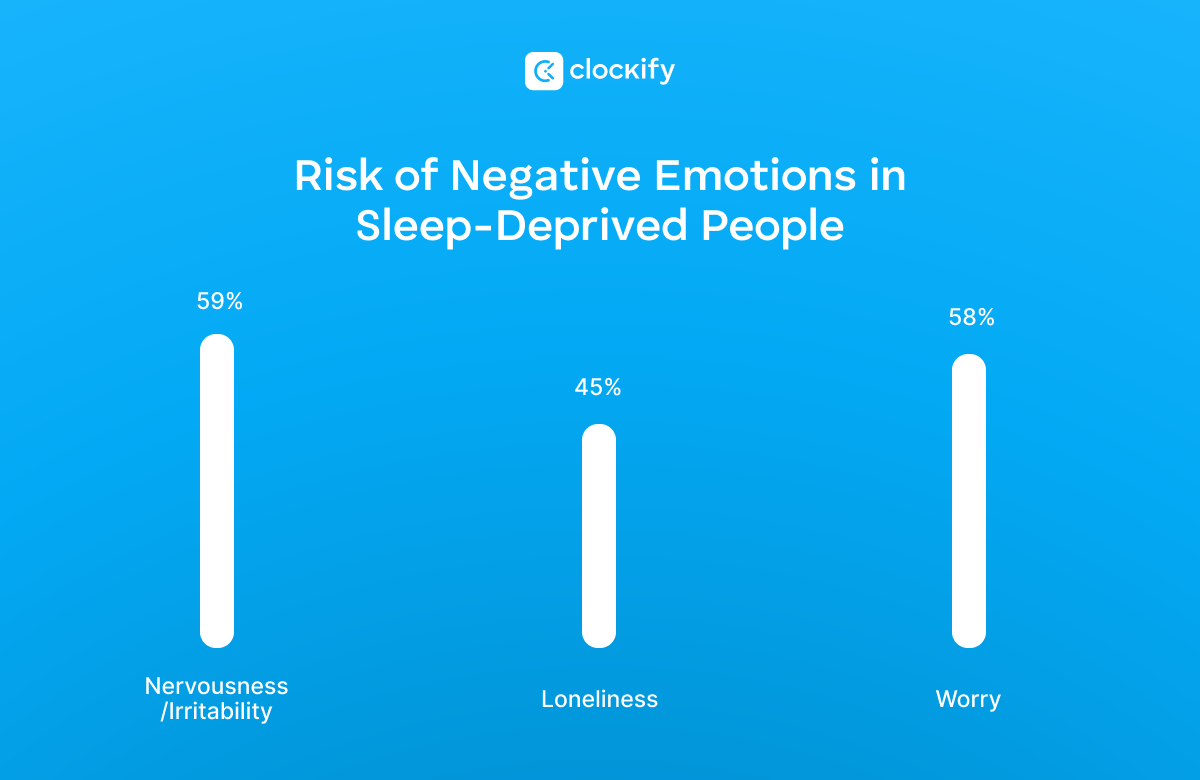
Sleep and mood go hand in hand. In exploring the emotions of sleep-deprived participants, the survey found that they are:
- 59% more likely to feel nervous and irritable,
- 45% more likely to feel lonely, and
- 58% more likely to feel worried.
Given that our emotions highly depend on sleep, we must allocate enough time to rest and maintain a consistent sleep schedule.
Statistics about time management and housework
Much of our free time goes to household chores. Yet, many factors impact the exact number of hours we devote to housework — including our country of residence and gender.
Let’s see how we tackle tasks around our homes.
Around 12% of our time goes to housework
UN Women’s report on unpaid care and domestic work showed that housework takes around 12% out of our day.
However, research on time use by Our World in Data (OWID) reveals that the exact time dedicated to housework varies across countries.
For example, Mexico invests 3 hours and 22 minutes per day in household chores — making it the housework champion.
On the other hand, South Koreans only allocate 1 hour and 29 minutes daily to housekeeping.
Based on the latest American Time Use Survey, an average US citizen spends 2 hours and 44 minutes a day on housework — like cooking, cleaning, and lawn care.
Drawing from the OWID report, let’s look at the top 10 countries where people dedicate most of their free time to housework:
- Mexico — 3 hours and 22 minutes,
- Portugal — 2 hours and 56 minutes,
- Italy — 2 hours and 42 minutes,
- India — 2 hours and 40 minutes,
- Poland — 2 hours and 40 minutes,
- Denmark — 2 hours and 34 minutes,
- France — 2 hours and 31 minutes,
- Belgium — 2 hours and 29 minutes,
- Austria — 2 hours and 25 minutes, and
- Germany — 2 hours and 21 minutes.
However, these time estimates can become more nuanced when distributed between men and women.
Women do 58% of the domestic work
Though we all struggle to keep up with chores, men and women don’t seem to split housework evenly.
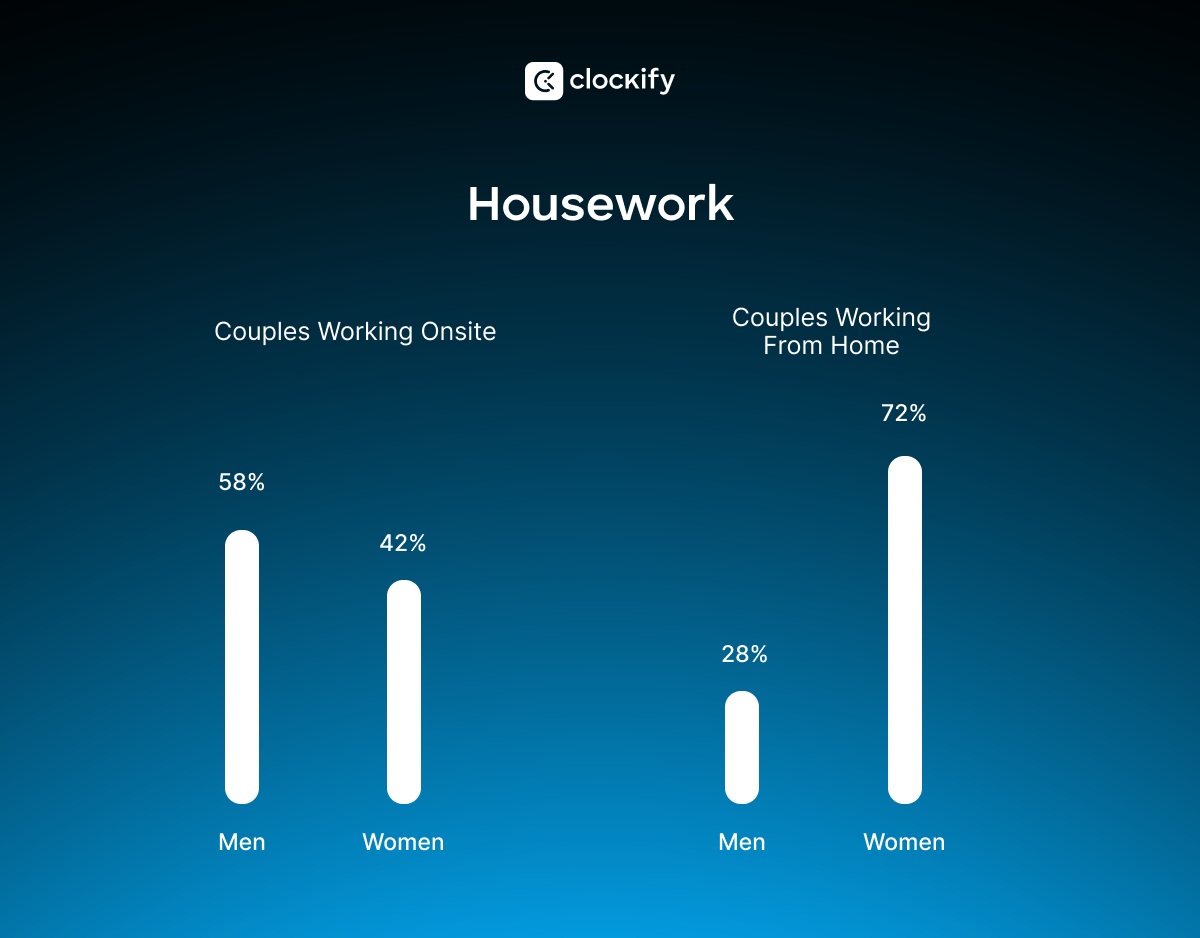
In fact, the Cake.com Gender Inequality in Unpaid Domestic Work Report revealed that, on average, women do 58% of all domestic work. On the other hand, men tackle 42% of household chores. Let’s explore the report’s findings further.
Surprisingly, men play a larger role when both partners work onsite — they do 58% of the domestic labor while women cover 42%.
Among couples who work from home, women take on 72% of household chores while men shoulder only 28%.
Interestingly, 70% of modern couples don’t split housework based on gender. Yet, certain gender-related bias still exists. For instance, women are 14.5% more likely to prepare meals and 4.5% more likely to do house cleaning.
Regardless, the CAKE.com Women in Tech Report showed that 77.77% of women are generally satisfied with their work-life balance. In other words, they’re content with how they manage tasks in their professional and personal lives.
Overall, women tend to dedicate more time to household tasks than men. Still, the Gender Inequality Report found that men take on more housework when both partners work at the office.
Statistics about time management and commuting
Did you know that an average American spends 15 to 29 minutes on a daily commute to work?
If you do the math, that amounts to roughly 13 days per year spent on work travel.
But what about the rest of the world?
Let’s look at the global commuting data.
Istanbul’s people lose 4 days per year to traffic congestion
Wherever you are in the world, you can’t avoid getting stuck in traffic now and then.
Yet, some citizens have it worse than others — losing hours per day stuck behind their wheels waiting for the traffic to move an inch.
According to the INRIX 2024 Global Traffic Scorecard, Istanbul tops the list of the most congested cities. In particular, Istanbul’s citizens waste 105 hours per year in traffic jams.
Unfortunately, as the report suggests, the rest of the world doesn’t fall far behind the largest city in Turkey. Here are the top 10 cities with the highest traffic delays:
- Istanbul — 105 hours,
- New York City — 102 hours,
- Chicago — 102 hours,
- London — 101 hours,
- Mexico City — 97 hours,
- Paris — 97 hours,
- Cape Town — 94 hours,
- Jakarta — 89 hours,
- Los Angeles — 88 hours, and
- Brisbane — 84 hours.
The costs of traffic delays on society go beyond lost time — impacting the environment and commuters’ mental health.
🎓 Interesting facts about commuting
Statistics on time management for students
Effective time management matters in every stage of life — especially during high school and college.
In fact, consistent routines promote personal growth among teenagers, helping them maintain control, improve self-confidence, and reduce stress.
But are they always successful at managing their time? Let’s see what the latest time management facts say.
🎓 Time Trackers Are Great Tools for Teachers. Here’s Why
Statistics on students' time management skills
Even though adopting habits is objectively easier for students, they often prioritize socialization and other fun activities.
For that reason, many students struggle with poor time management and frequently need help with self-improvement.
Let’s see what this looks like in practice.
47% of college students need help organizing their time
Organizational skills are crucial for various aspects of life — especially for academic studies and professional careers.
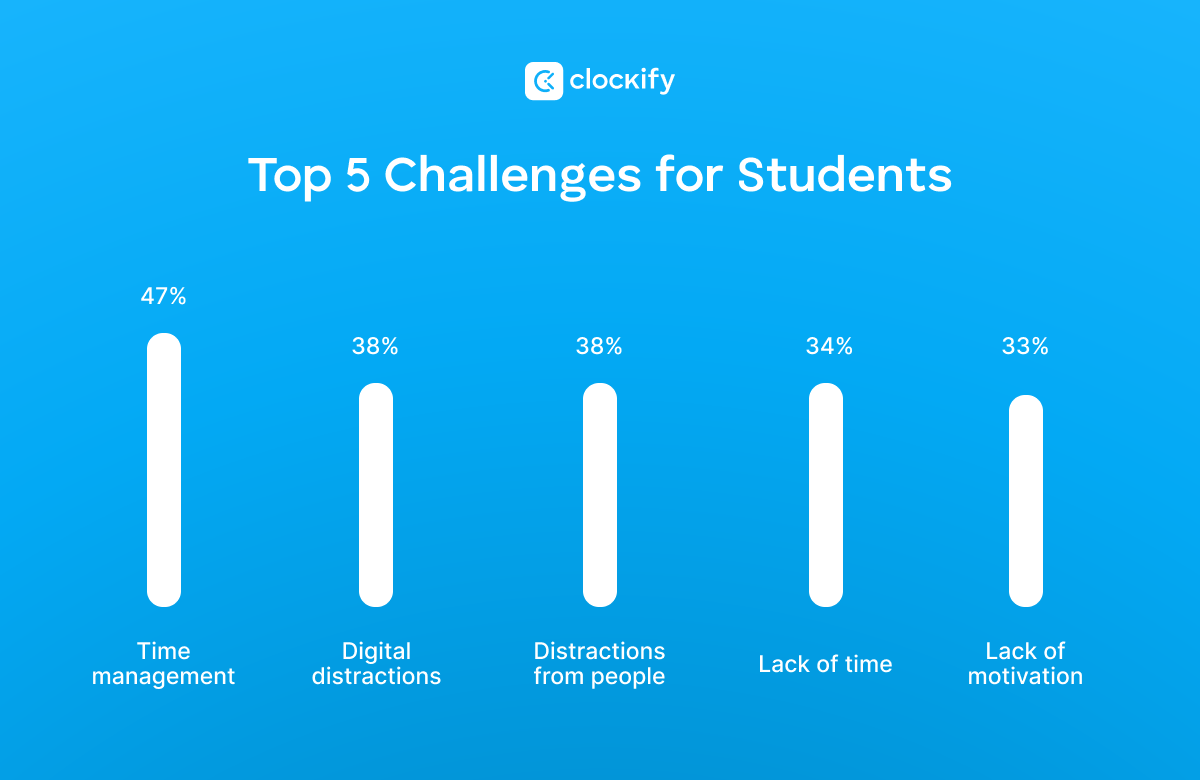
As Kahoot!’s 2024 report on study habits shows, nearly 47% of college students say that time management is the biggest challenge affecting their studies.
Students’ struggles with organization may also lead to sleep deprivation. The research shows that 31% of students report getting 5 hours of shuteye or less per night.
Unfortunately, this can trigger a ripple effect further down the road — causing procrastination, high stress, and poor mental health.
🎓 How to plan your day and stay organized
75.5% of students struggle with procrastination
Different studies point to different percentages, but one thing remains certain — most college students procrastinate.
In fact, a 2024 survey by the American College Health Association revealed that 75.5% of students procrastinated over 12 months.
Now let's see why the tendency occurs.
As a paper on student procrastination suggests, college life offers the first taste of independence, but it also comes with sole responsibility over their studies.
The above report lists time management issues, low motivation, and perfectionism as the main causes of academic procrastination for most students.
🎓 Procrastination guide: Why it happens and how to overcome it
52% of students submit their assignments on time
Some say the deadline is the best motivation — others see it as a stressor. The truth is in the middle, reflecting the importance of time management.
Based on a study on assignment submission and time management, nearly 52% of students submit their tasks on time.
On the other hand, 43.4% of students delay their assignments, while 4.7% fail to submit theirs.
A closer look at the results showed that nearly 34% of female students submit their assignments on time compared to 18% of male students.
However, female participants are also more likely to delay submitting tasks. In fact, 26% of female students postpone turning in assignments, as opposed to 17.4% of male students. Hence, gender can impact the likelihood of procrastination.
The study also uncovered that the task type can affect students’ commitment to deadlines and, by extension, productivity. To illustrate, students were more likely to turn in presentations rather than written assignments.
Generally, written tasks are seen as dull, daunting obligations. In contrast, presentations allow students to express their ideas visually and verbally. In that sense, a dynamic and interactive learning experience fuels motivation.
🎓 Student guide to productivity
Interesting time management statistics and facts
Research has shown that spending money on time-saving activities like allocating chores could make you happier.
In the following segment, we’ll cover more interesting time management statistics.
4-day workweeks make US employees happier and more productive
Compressed workweeks are becoming increasingly popular for their multiple benefits — from employee satisfaction to a healthy work-life balance.
According to the latest Work in America survey, a 4-day workweek would make 81% of US employees happier and just as efficient.
The research further revealed that 33% of surveyed Americans lack flexibility at work, which disrupts their work-life balance.

This example demonstrates how current time management facts directly impact productivity statistics in the workplace. Decision-makers in the workplace should consider both when defining growth goals.
🎓 How Grip Made Clockify a Part of Their Growth Strategy
87% of workers want to try chronoworking
The traditional 9-to-5 workday generally reflects an early bird’s schedule. But, with the rise of flexible work, a new solution has emerged for night owls.
Enter chronoworking — the practice of aligning your working hours to fit your circadian rhythm (your internal clock). The work trend aims to help you pinpoint your most productive hours.
According to a Canadian study on chronoworking, 87% of professionals want to try chronoworking.
The reason is simple — 48% of the surveyed workers believe their mental health would improve if they worked according to their sleeping habits.
The research also predicts better productivity statistics in the workplace for companies that endorse this trend. For instance, 33% of employees believe chronoworking would improve their focus and productivity.
🎓 How I calculated my biological prime time
Bonus: Time management FAQs
Let’s tackle the most common questions related to understanding the importance of time management. The answers should help you get the big picture.
Is time management a life skill?
Generally speaking, yes. In particular, time management encompasses an array of various skills related to:
- Planning,
- Organization, and
- Execution of tasks.
Many students start managing their time in school to boost their productivity in completing academic tasks. But, more seriously, this experience serves as early preparation for future work responsibilities.
However, not many people understand that they can also reap the benefits of these organizational skills in their personal lives.
What makes time management effective?
Effective use of time refers to a unique skill set — it varies from person to person.
In plain words, it means to work smarter, not harder.
A person with a strong time management system can organize tasks to ensure that each one gets enough time and attention.
Additionally, studies on sleep hygiene estimate that we spend around ⅓ of our lives sleeping. Despite the daunting statistics, you need sleep. Without enough energy, you’re less likely to use your time wisely.
So, using time effectively means getting enough rest and being productive during daytime hours.
What are the benefits of effective time management?
Many experts on time management have recognized a direct link between good time allocation and multiple perks, including:
- Better mental health — being in charge of your schedule boosts your self-image and reduces stress.
- Improved productivity and focus — Showing up on time, meeting deadlines, and being efficient at work help you earn the respect of others.
- Healthier work-life balance — time organization skills allow you to set boundaries between your work and personal life.
Organize your time better with Clockify
With these benefits, your time passes smoothly, and life runs like a well-oiled machine.
🎓 10 Ultimate Steps to Improve Time Management Skills
What is the golden rule of time management?
The golden rule of time management is to do your most important tasks first. This simple yet powerful habit will help you set the tone for a successful day.
Likewise, several productivity methods are designed to help you focus on your priorities, including:
- The 90/10 rule — the idea that 10% of your activity can account for 90% of the outcomes. This principle motivates people to identify a few high-value tasks and allocate the rest for maximum productivity.
- The Eat-the-Frog method — a practice of pinpointing and completing the biggest task of the day first. Finishing the most intimidating assignment will boost your motivation and increase your chances of getting things done faster.
Prioritize tasks better with Clockify
Essentially, task prioritization is a fundamental aspect of time management and can become second nature with enough willpower and practice.
What is the best way to manage your time?
If global time management facts are any indication, there isn’t a single best way to organize time.
According to experts on time optimization, here’s how successful people ensure they never waste time at work:
- Review your schedule — eliminate low-value tasks that distract from important matters,
- Make decisions quickly — avoid overthinking and trust your judgment, and
- Delegate effectively — outsource tasks that don’t require your skills and expertise.
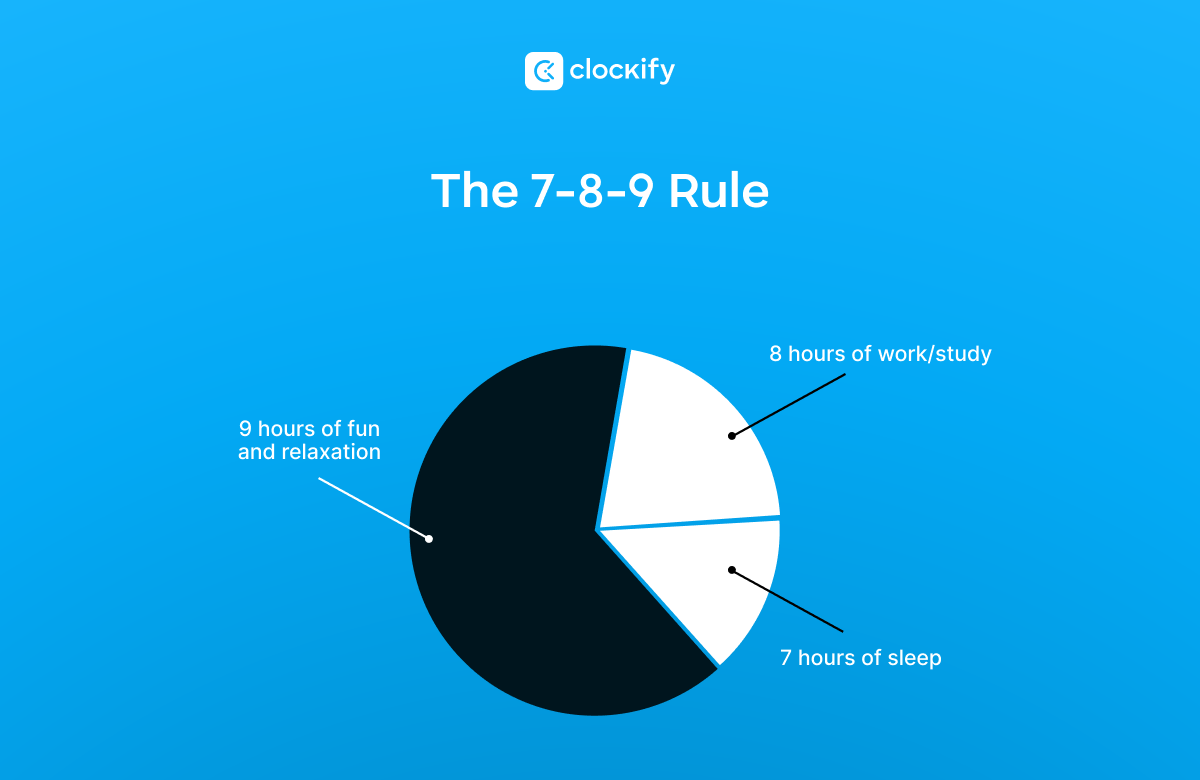
In work and study settings, a commonly used time management strategy is the 7-8-9 rule. To maintain a work-life balance, this rule suggests that you allocate:
- 7 hours to sleep,
- 8 hours to work or study, and
- 9 hours to personal interests and relaxation.
Naturally, everyone should experiment with various productivity tricks to find what works for them. Take tech innovations, for example. From automated tasks and reminders to productivity tracking and reporting, these practical features will enhance your efforts.
After all, accessible digital solutions like these can help you develop time-saving habits.
🎓 Daily Routines and Habits of Successful People
Use Clockify to master your time
The numbers don’t lie. Nobody’s perfect at managing their time.
While our time management statistics reveal global struggles with mental health, distractions, and procrastination, they also suggest a universal solution.
Clearly, you need to build a custom time management system — with the right tools.
Implementing a simple time tracker like Clockify can help you safeguard your most limited resource (time) by skipping unnecessary steps.
In particular, Clockify promotes time-saving habits by letting you:
- Track work hours,
- Stay on top of tasks, and
- Make predictions about the cost and duration of projects.
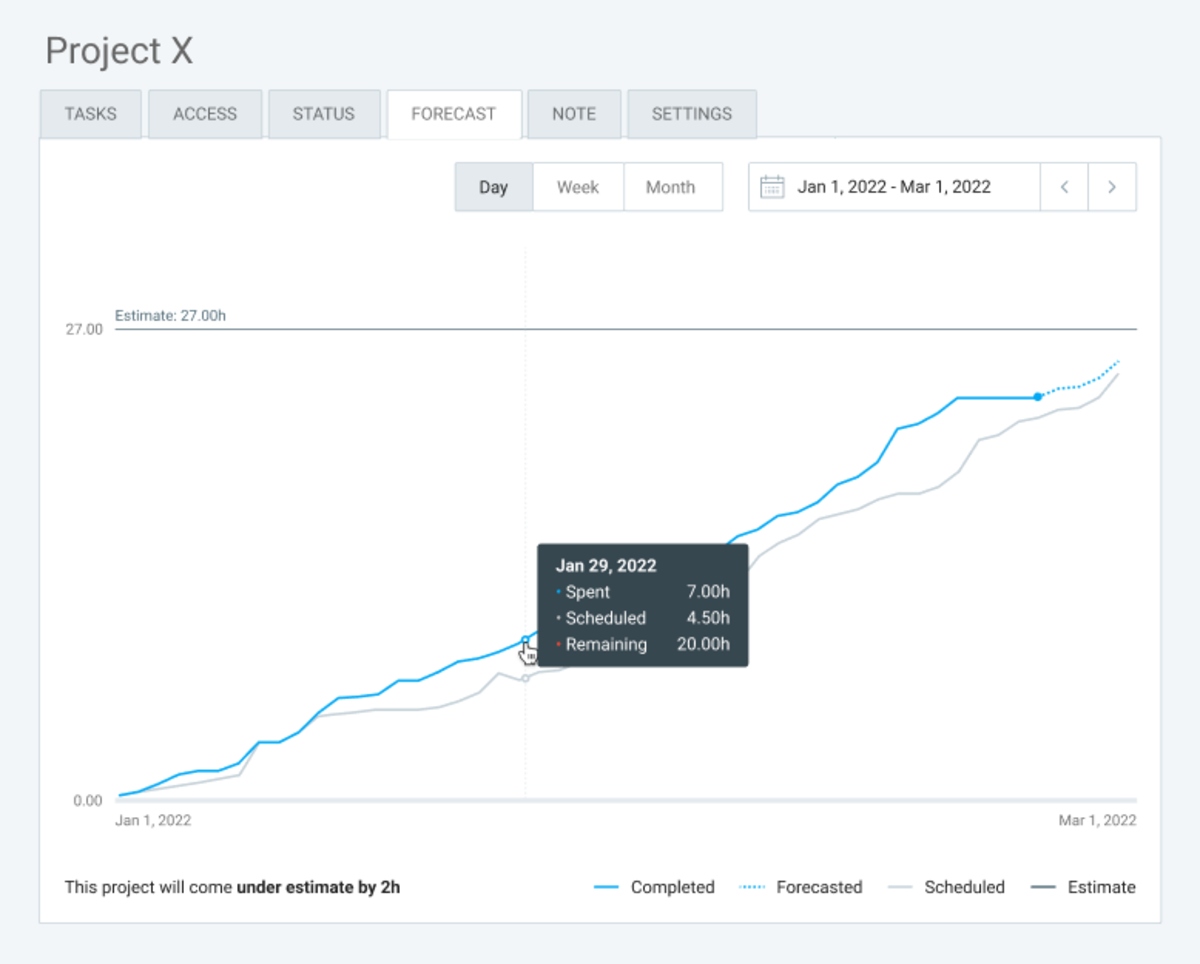
Project forecasting feature in Clockify
Our all-in-one app can help you picture your day by integrating with your Google or Outlook calendar. That way, you can schedule events and see all your tasks in one place.
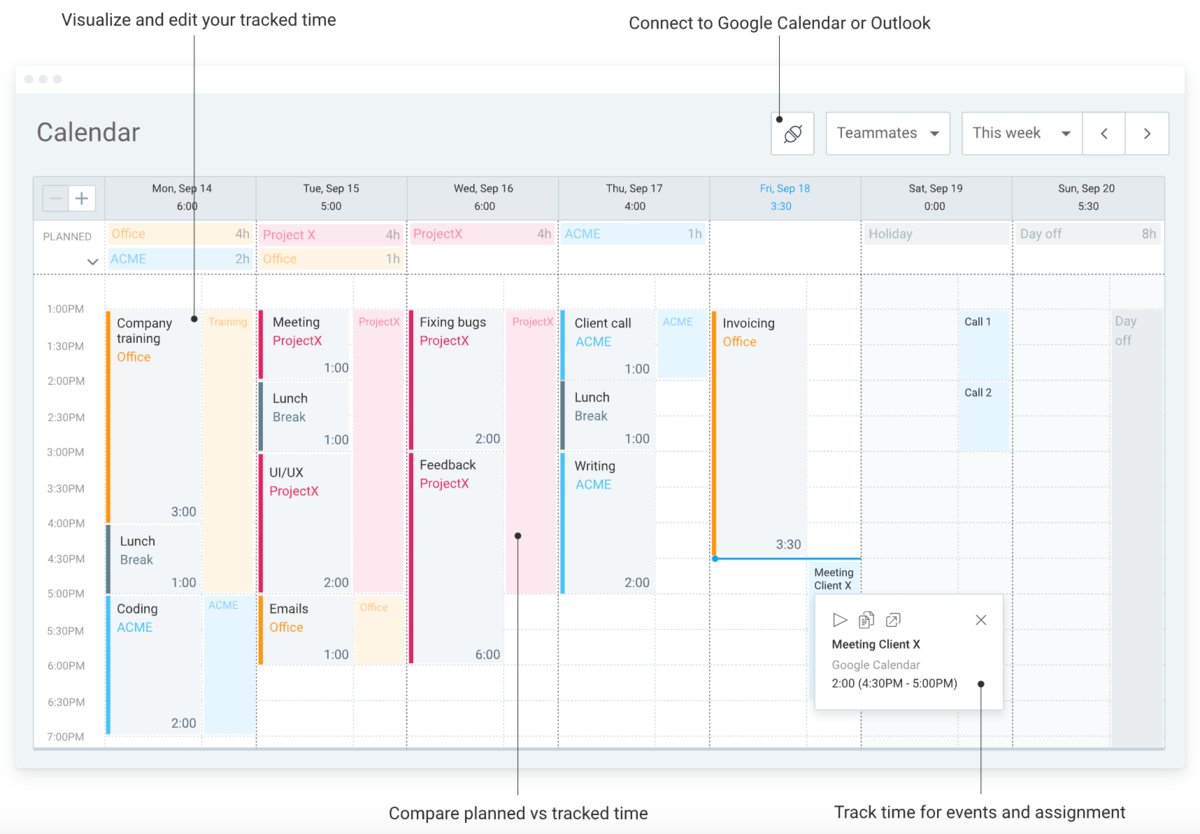
Calendar feature in Clockify
Clockify helps hard workers protect their time by building productive habits with time tracking.